

If you’re serious about growing your website, tracking your traffic is necessary. Google Analytics is your go-to tool for understanding how visitors interact with your site—where they come from, what they’re doing, and what keeps them around (or makes them leave). Here’s a step-by-step guide to help you check website traffic on Google Analytics, explained in simple terms with a sprinkle of wit.
Why Use Google Analytics for Website Traffic?
Google Analytics gives you the full story of your website’s performance, from total visitors to specific traffic sources like search engines, social media, or ads. Without it, you’re flying blind in a storm, hoping for the best.

Key Metrics You’ll Track
Sessions: The number of visits to your site.
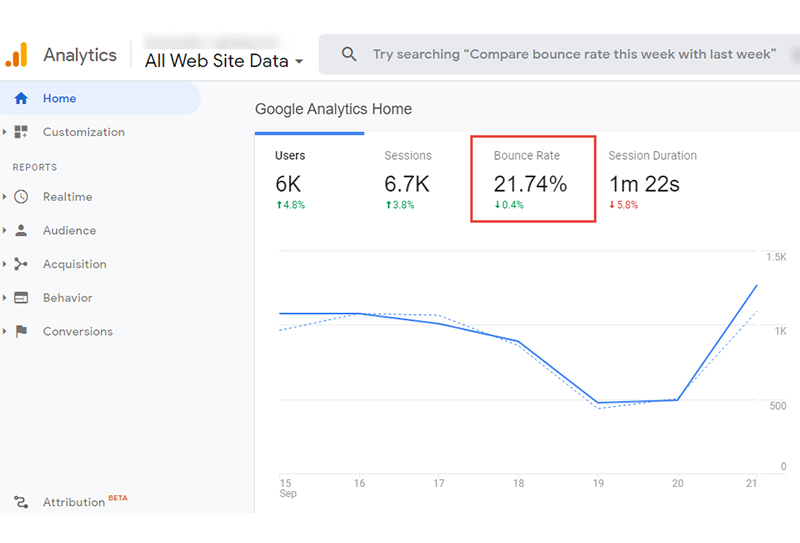
Bounce Rate: Percentage of visitors who leave without interacting.
Users: Unique visitors coming to your site.
Pageviews: Total number of pages viewed by users.
Traffic Sources: Where your visitors are coming from.
How to Check Website Traffic on Google Analytics
Step 1: Set Up Google Analytics
Before you can check traffic, you must install Google Analytics on your website. Here’s how to do it:
Paste the code into your website’s header (or use a plugin if you’re on WordPress).
Sign up at analytics.google.com using your Google account.
Create a new property for your website.
Copy the tracking code provided.
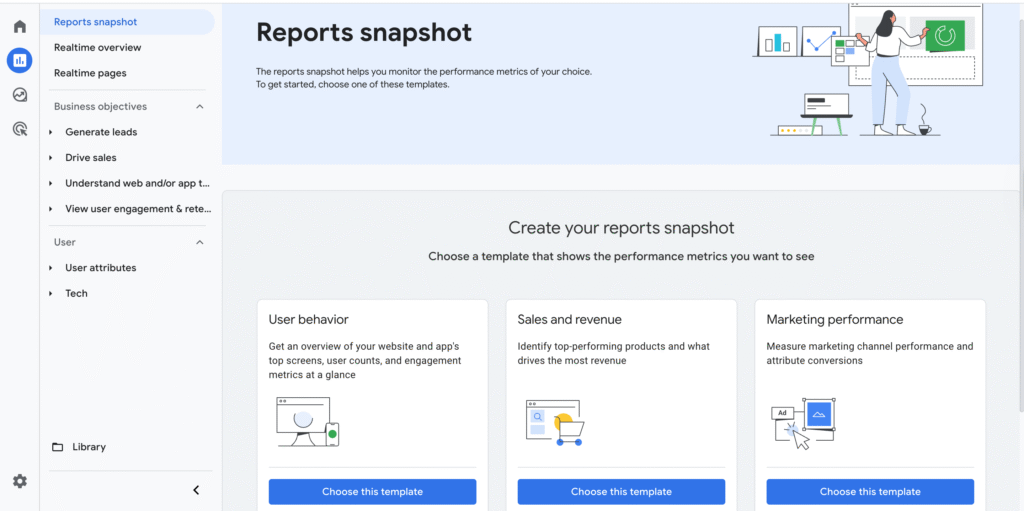
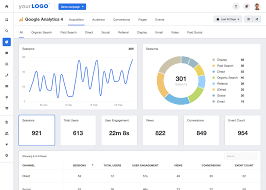
Step 2: Open the Google Analytics Dashboard
Log in to Google Analytics and select the property associated with your website. The dashboard is where all the magic happens.
Step 3: Navigate to the “Reports” Section
This displays traffic for individual pages.
In the left-hand menu, click on “Reports.”
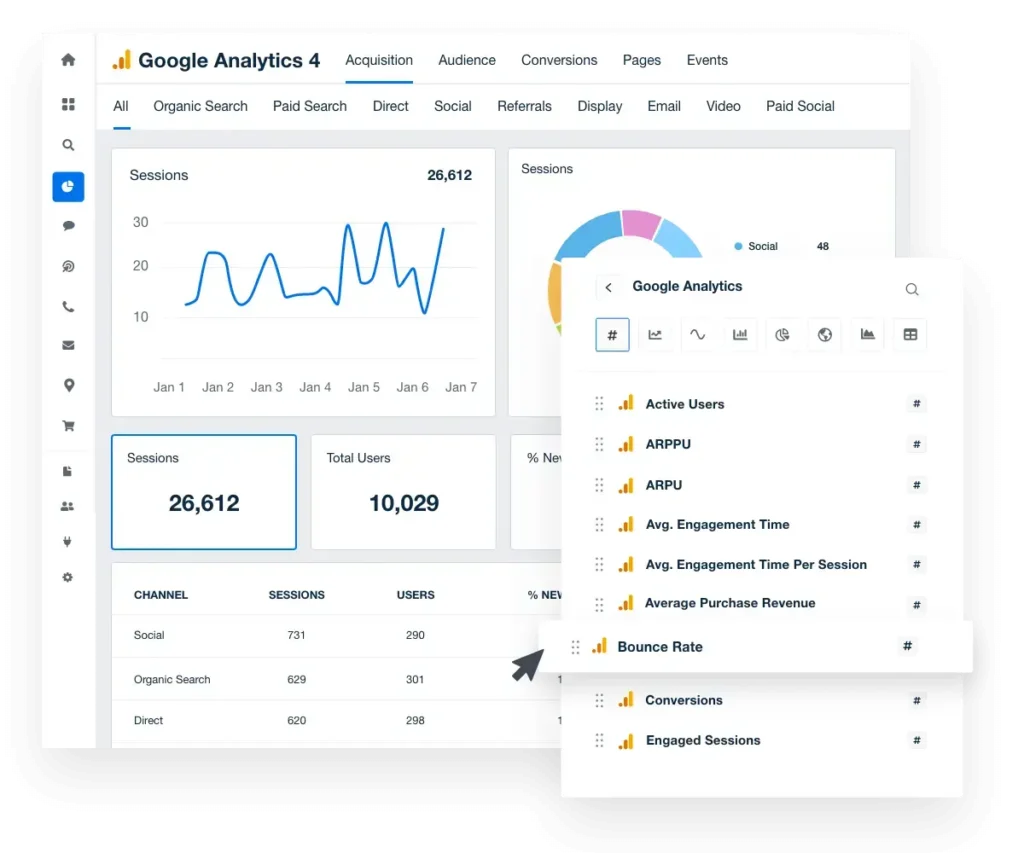
Under “Life Cycle,” select “Acquisition” > “Overview.”
This shows you where your traffic comes from (organic search, paid ads, social media, etc.).
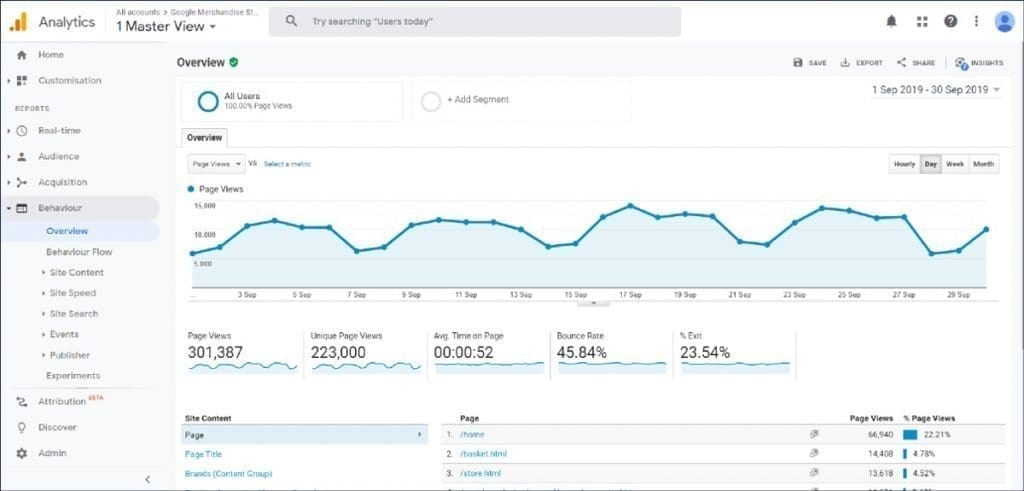
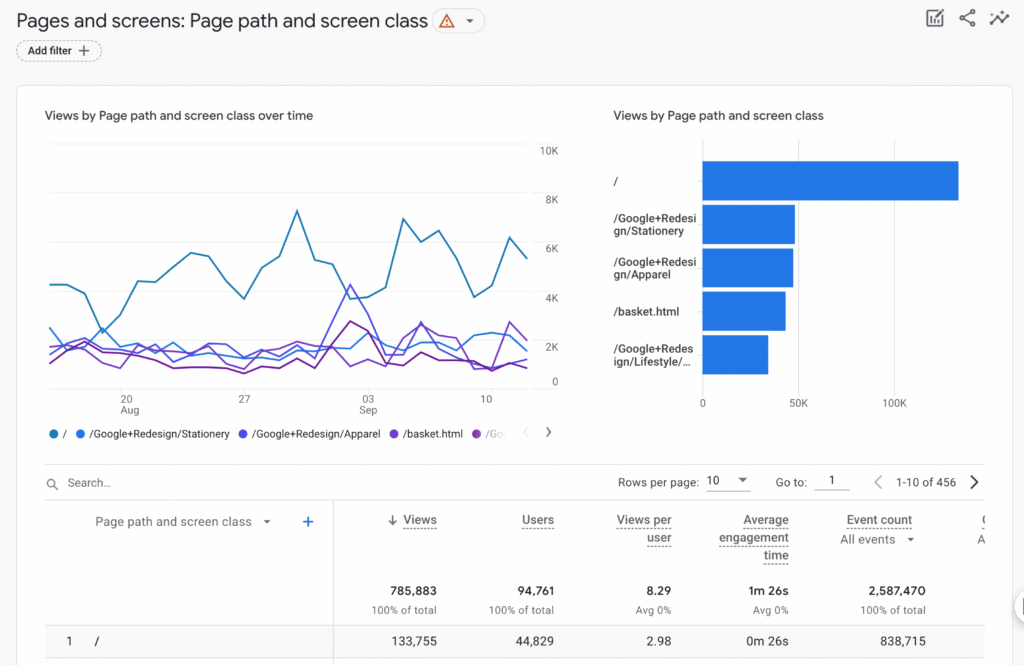
For detailed traffic numbers, go to “Engagement” > “Pages and Screens.”
“Google Analytics turns clicks into clarity—see exactly who’s visiting your site.”

Breaking Down the Traffic Sources
- Organic Search
Traffic from search engines like Google. If your numbers here are low, it’s time to boost your SEO game.
- Direct Traffic
Users who typed your URL directly into their browser. This usually indicates brand awareness or returning visitors.
- Referral Traffic
Visitors who came from other websites linked to you. If this is high, your backlinks are doing their job.
- Social Media
Traffic from platforms like Facebook, Instagram, or LinkedIn. If you’re investing in social campaigns, this is where you’ll see the results.
Stat: Businesses that track traffic by source grow 2x faster than those that don’t.
“Every visitor leaves a trail—Google Analytics helps you follow it.”
Advanced Tools in Google Analytics
- Real-Time Traffic
Check “Realtime” > “Overview” to see who’s on your site right now. Perfect for monitoring campaigns or launches.
Example: During a product launch, I saw 200 visitors on my landing page in real time, so I knew my email blast was working.
- Behavior Flow
Go to “Engagement” > “Behavior Flow” to see how users move through your site.
- Are they clicking your CTA or bouncing after the homepage? This tool gives you answers.
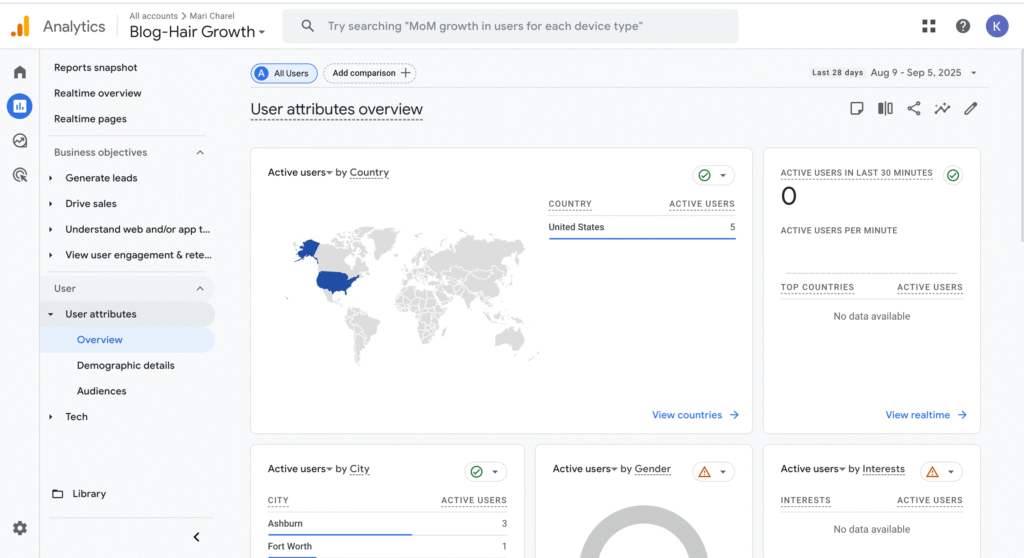
- Audience Insights
Under “Audience” > “Overview,” you can learn about your visitors:
- Age, location, device type, and more.
Example: I discovered that 70% of my visitors were mobile, so I optimized my site for smaller screens.
Tips to Make the Most of Google Analytics
- Set Goals: Define what success looks like (e.g., form submissions, purchases).
- Use Filters: Exclude internal traffic from your team to avoid skewing numbers.
- Track Campaigns: Use UTM codes to track specific campaigns and see which brings in the most traffic.
- Monitor Trends: Look for patterns in traffic spikes or dips.
- Integrate Tools: Sync Google Analytics with Google Ads for even deeper insights.
How Google Analytics Beats Guessing
With Google Analytics:
- You know exactly where traffic comes from.
- You can focus your marketing dollars on what works.
- You catch issues like high bounce rates before they hurt conversions.
Without Google Analytics:
- You’re left wondering if anyone’s even visiting your site.
- Your marketing is a shot in the dark.
- Problems go unnoticed until it’s too late.
How to Interpret Google Analytics Data for Business Decisions
Google Analytics is a goldmine of data for your website, offering insights that can transform your online presence into a thriving business. But here’s the catch: Data is only useful if you know how to interpret it and take action. In this article, we’ll dive into the key metrics Google Analytics provides and show you how to use them to make informed, impactful business decisions.
Why Interpreting Data Matters for Your Business
Collecting data is one thing; turning it into actionable insights is another. With Google Analytics, you can answer critical questions about your audience, their behavior, and your website’s performance, such as:
- Who is visiting your site, and where are they coming from?
- What pages are keeping users engaged?
- Are visitors completing your desired actions (like signing up, purchasing, or downloading)?
Properly interpreting these metrics helps you:
- Allocate resources effectively.
- Tailor content to your audience.
- Optimize your website for conversions.
Let’s break down the core metrics and how to use them.
Core Metrics to Monitor and What They Mean
1. Sessions
What it tells you:
Sessions represent the total number of visits to your website, including repeat visits from the same user.
Business decision tip:
A drop in sessions could signal issues like a technical problem or declining interest, prompting a need for site updates or new marketing efforts.
A growing number of sessions indicates an increase in traffic. Analyze traffic spikes to identify successful campaigns or content that’s driving more visits.

2. Users
What it tells you:
This metric counts unique visitors. Each user is counted once, even if they visit multiple times.
Business decision tip:
Compare users to sessions to understand how many repeat visitors you have. High user numbers and low sessions might indicate people aren’t returning. Consider launching a newsletter or loyalty program to encourage repeat visits.
3. Page views
What it tells you:
Pageviews indicate how often your website’s pages are viewed.
Business decision tip:
Pages with low views might need optimization or a stronger call-to-action to increase engagement.
Identify your most viewed pages and replicate their structure or content to replicate success elsewhere on the site.
4. Bounce Rate
What it tells you:
Bounce rate shows the percentage of visitors who leave your site after viewing only one page.
Business decision tip:
Aim for a lower bounce rate on key landing pages by including clear calls-to-action and engaging content.
A high bounce rate could indicate irrelevant content, slow loading times, or poor design. Use heatmaps or conduct A/B tests to pinpoint and resolve issues.
5. Traffic Sources
What it tells you:
Traffic sources reveal where your visitors are coming from: organic search, direct traffic, referrals, social media, or paid ads.
Business decision tip:
High referral traffic might suggest your backlinks strategy is working—double down on partnerships or outreach campaigns.
If organic search traffic is low, invest in SEO strategies like keyword optimization or content updates.


Interpreting Data to Improve Website Performance
1. Find Out Where Visitors Drop Off
How: Use the Behavior Flow report under Engagement.
Why it matters: This shows you the pages where users enter your site, the paths they take, and where they drop off.
Example Action:
If users frequently leave after visiting your pricing page, consider revising the content to make it more persuasive or adding testimonials to build trust.
2. Identify High-Performing Content
How: Check the Pages and Screens report.
Why it matters: This highlights which pages get the most views and engagement.
Example Action:
Repurpose your high-performing blog posts into other formats, like videos or infographics, to attract new audiences and extend your content’s reach.
3. Monitor Audience Behavior on Mobile vs. Desktop
How: Review the Audience > Technology section.
Why it matters: With most users browsing on mobile, a poor mobile experience can cost you traffic and conversions.
Example Action:
If mobile traffic has a higher bounce rate than desktop, optimize your site for mobile by improving loading speeds, simplifying navigation, and using responsive design.
4. Understand Your Audience Demographics
How: Explore the Demographics report under Audience.
Why it matters: Knowing your audience’s age, gender, location, and interests allows you to tailor content and marketing.
Example Action:
If a significant portion of your audience comes from a specific region, create localized content or run geo-targeted ad campaigns to boost engagement.
5. Measure Campaign Effectiveness
How: Use Acquisition > Campaigns to analyze UTM-tagged campaigns.
Why it matters: This helps you track which campaigns are driving the most traffic and conversions.
Example Action:
If email campaigns outperform social media ads, allocate more budget to email marketing while refining your social strategy.
Turning Insights Into Business Strategies
1. Optimize Underperforming Pages
Use the Site Content report to identify pages with low engagement or high exit rates. Rewrite content, improve visuals, or add internal links to boost performance.
2. Focus on Conversion Rate Optimization (CRO)
Track Goals (e.g., form submissions or purchases) to see how well your site converts visitors into leads or customers. For low-performing pages, test different layouts, calls-to-action, or offers to improve results.
3. Leverage Seasonal Trends
Review historical data to spot trends in traffic spikes or dips, such as during holidays or promotions. Plan campaigns to capitalize on these periods and boost sales.
4. Expand Successful Campaigns
Identify the traffic sources or campaigns driving the highest-quality leads (e.g., those with the longest session duration or highest conversion rate). Replicate these tactics across other channels.
5. Set SMART Goals
Set Specific, Measurable, Achievable, Relevant, and Time-bound goals in Google Analytics. For instance: “Increase organic traffic by 20% over the next three months.” Track progress and adjust strategies as needed.
Conclusion — Making Website Traffic Work for You
So, what is website traffic? At its core, it’s people—real visitors showing up to your site, clicking around, and either sticking with you or leaving. Google Analytics takes the guesswork out of understanding that flow. It shows you who’s coming, where they’re coming from, and what they do once they land on your pages.
If you’re serious about growth, tracking website traffic isn’t optional—it’s essential. Without it, you’re flying blind. With it, you can make smart moves: fix weak spots, double down on what works, and guide visitors toward becoming loyal customers.
Bottom line? Google Analytics isn’t just a tool. It’s your roadmap to turning visits into results. And once you know how to check your website traffic, you’re no longer just collecting data—you’re building a strategy that actually drives growth.
Related Articles
Website Traffic: How to Get More Visitors Without Wasting Time or Money
SEO Strategies to Boost Website Traffic for Beginners [Easy Steps]
SEO vs. Paid Ads: Which Brings Better Long-Term Results
Referral Links vs Backlinks: What 91% of Websites Get Wrong About Traffic and Growth
Which Report Indicates How Traffic Arrived at a Website: Easy Breakdown